Geeky stuff ahead…
Scripting remains much as it was in V1.x. However, internally there are a lot of changes (still to be made), and since some features have been made redundant by V2 (e.g. local vs. global observations, arbitrary user-defined fields, etc.), the scripting extension changes might require some of the V1.x scripts to be tweaked. Also the scripting language syntax is a bit less flexible, and stomps on some syntactical no-nos that were not picked up in V1 (which I consider a good thing).
I plan to tweak the user-contributed plans myself for V2, but where applicable I will warn the authors of any work needing to be done.
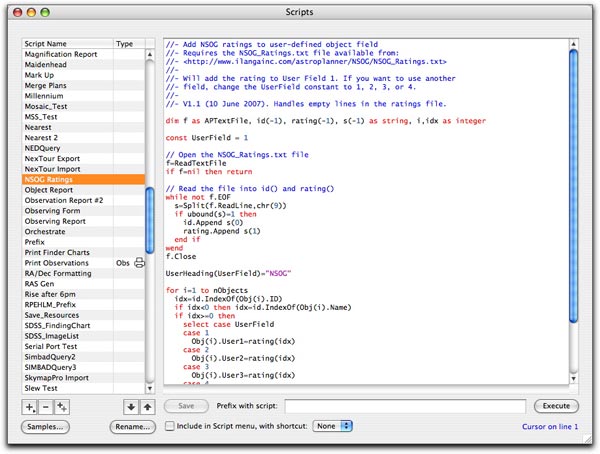
Here’s the (current) incarnation of the script editor:

Things to note:
Syntax colouring of the code. This is automatic and runs in a background thread. Currently it’s quite flaky on Windows for some reason, but I’ll be working on that. You can choose your colours via a dialog, or switch it off altogether if you like.
Another change (less than one day old), which is more significant, is the Type column in the list of scripts. You’ll notice a script called “Print Observations” with “Obs” and a printer icon in the Type column. This is the start of a revelation I had on Christmas day (no, don’t read anything into that!). One of the primary bleats from users is that the printing doesn’t live up to their expectations. Hey, it doesn’t live up to mine…
Printing code is tricky and difficult to get right. Especially difficult to get right for everyone, it would seem. What I’m currently looking at is a new scheme, using scripting to do the actual printed page layout. Most of the “machinery” is already there (Canvas, Tables, etc.). All that needs to be done is wire it into the print dialog/s. The print dialogs will let you do stuff like select objects/observations/etc. to print, what to print (e.g. forms, reports, DSS images, etc.), much as happens now. That information will then be passed to special printing scripts (virtually identical to current general scripts), where the code will do the work of setting up the page.
This way of doing things has several advantages over the old, fixed method of printing:
- Print previews can be done to see what the report is going to look like before committing it to dead trees.
- Several different formats of printing the same report can be created.
- Making changes will typically not require any changes to the application code.
- User-contributed printing scripts will enrich the user experience. For example, Michael Portuesi’s great Finder Chart script could be quite easily converted to a printing script, accessed like any other printed report.
- New types of reports can be created without having to release a new app version (e.g. double star observation reports in some approved format, “printing” to a web page or XML file, etc.)
You’ll edit the scripts in the script editor, but they’ll only be available from the print dialogs for objects and observations.
As I said, this is less than a day old, so I’m not quite sure of the complete ramifications of this scheme of doing things. There’s likely to be more stringent limitations on printing scripts (which will be documented), and I will probably do more testing of any user-contributed printing scripts than I would typically do with general scripts.
Script authors (and I think there’s just a handful of you out there) are welcome to discuss this with me.