One of the major gripes about V1 was the somewhat inflexible and limited printing mechanism. No-one was satisfied (including me). You could never get your plan objects and or observations printed the way you wanted them. More annoyingly, you had to waste paper to see what you were going to get.
Added to problem was the really nasty printing code within AstroPlanner. Making changes to it was a nightmare, and required five cups of coffee (and sometimes a few shots of the hard stuff) to render me brave enough to open up the code.
V2 changes all that. The scripting mechanism is now called to do the printing. This has many benefits:
- Making changes means that only a script needs to be changed (in general). Script-savvy users can change the printing code for themselves. A new release of the application isn’t required.
- User-contributed printing scripts will open up the app to all sorts of new and improved printing concepts. See below.
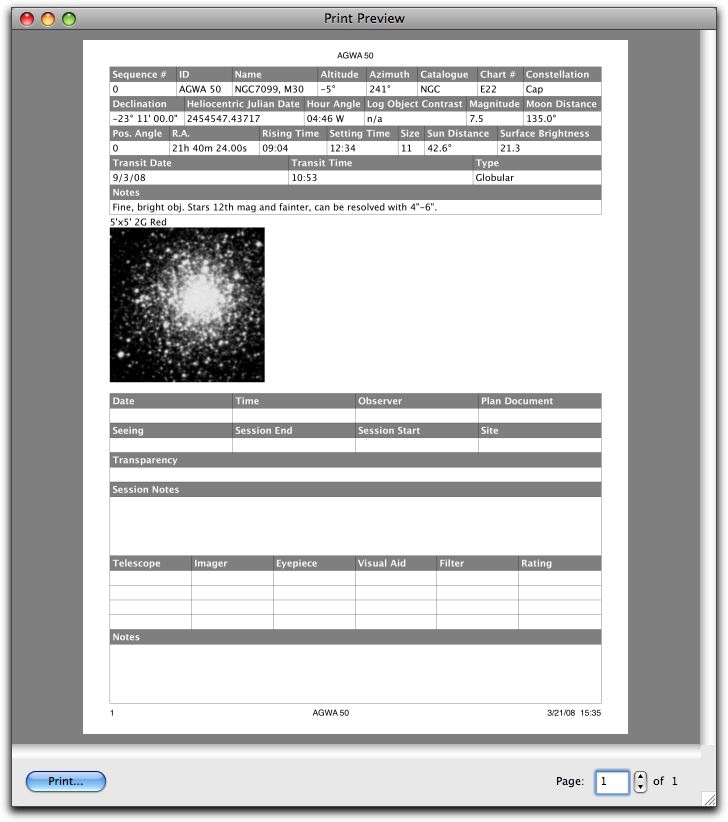
- All printing now comes with a built-in “preview” so you can see the entire document before committing it to dead trees.
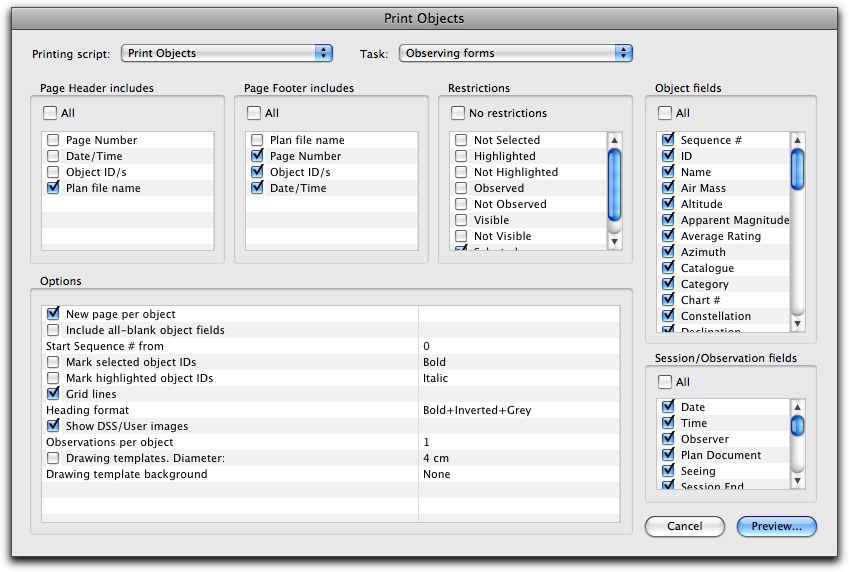
Let’s see what it entails. Firstly there’s a new print dialog that appears when you use File->Print…

The first thing you’ll notice (well, apart from the fact that it’s completely different) is the Printing script and Task popups at the top. There will be default scripts built into AstroPlanner, but any other printing scripts you might have developed or downloaded will appear in the popup. Each script can handle one or more printing tasks (in this case, printing Objects, Observations, Forms, etc.).
The other parameters are all defined by the script itself. More below.
Once you’ve set up your parameters to your liking (yes – they’ll be remembered), you click the Preview… button to see the result, in the full resolution of your printer.

You can scroll through the pages, and when you’re ready, click the Print… button to dump to dead trees.
So, what juicy new ideas can you come up with? Here’s some that come to mind:
- Michael Portuesi’s Print Finder Charts script can be quite easily (sic) converted into a printing script. Then you’ll have finder charts “built-in” rather than as a separate script with a separate interface.
- Specialty reports for double star observers, that can combine all the observations of a particular star together, compute statistics, and even print reports formatted to looks like (for example, BAA or Web Society standards).
…and many other weird and wonderful ideas.
How is this all done?
Magic? In the words of Arthur C. Clark (1917-2008. R.I.P): “Any sufficiently advanced technology is indistinguishable from magic.”
Well, perhaps not magic. Just code. The going gets nerdy from here out, so feel free to abandon this posting if you aren’t a script kiddie.
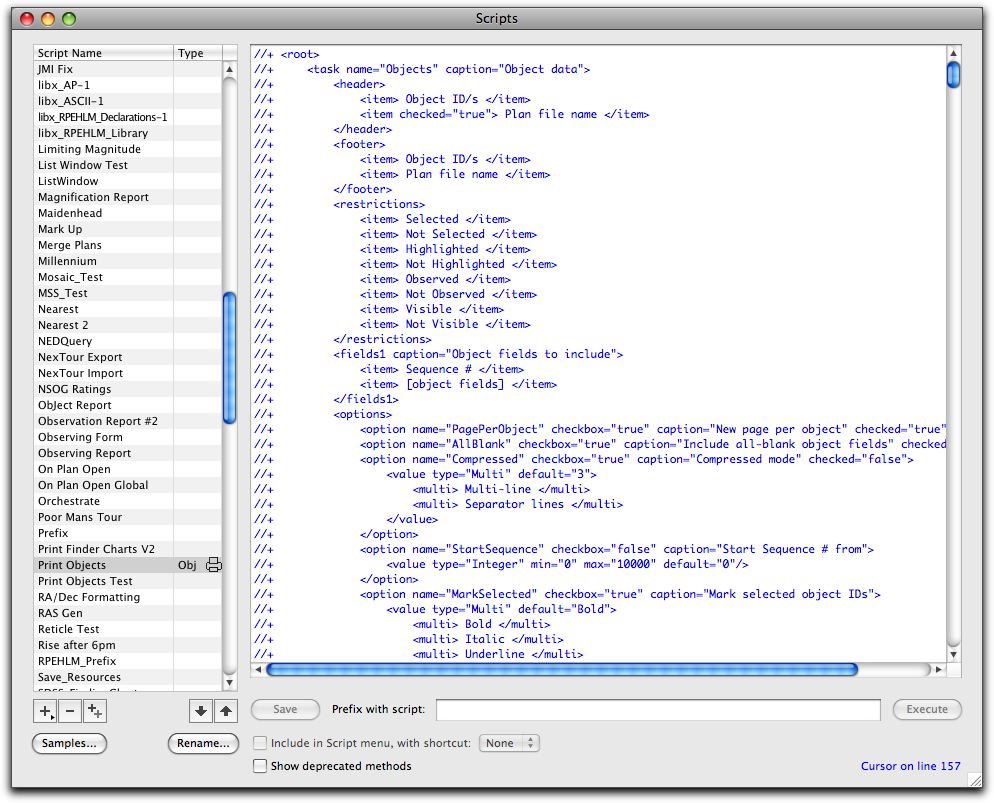
I made mention in a previous posting that there are now “special” scripts for printing. These are largely identical to normal scripts, except that:
a. They contain a description of the user interface elements.
b. They make use of the PrinterCanvas object rather than a plain Canvas object.
The user interface is defined using XML, which is added to the script as a specially formatted set of comments.

The printing mechanism extracts this definition from the script and uses it to set up the dialog interface. It’s then up to the program part of the script to use those settings and options to figure out what to print.
By using the PrinterCanvas (a subclass of Canvas) you can access all the options and settings. A lot of the common stuff is handled for you (such as printing headers and footers). The rest is up to you.
Sure getting the scripting going to the extent that it’s equivalent to (or better than) the existing V1 mechanism requires a fairly complex script. However, your script will probably be a lot simpler.
Yes, I will make the default script code available for you to look at, modify, etc.
I’m still working on printing the observation database, so there might well be a Part 2 of this posting later.
…and, as usual: Any or all of this might change between now and the final release.
Chris Todd | 23-Mar-08 at 4:17 pm | Permalink
Paul, cool stuff! I would be especially interested in being able to print observations, as I am pursuing several of the Astronomical League observing clubs, and I’m sure there are other folks that would like to be able to customize the layout of observation printouts.
This is probably a stupid question, but may I assume that the user attachments you are adding to V2 (e.g. sketches or photos) could be printed as well? Many of the AL observing clubs require sketches. I suppose one challenging aspect of that would be how to handle sketches or photos of various sizes, but I guess that’s what makes the scripting approach to printing so powerful!
V2 is looking better and better all the time, keep up the good work!
admin | 23-Mar-08 at 4:21 pm | Permalink
@Chris
Not a stupid question at all. Yes, you will be able to print attached sketches, etc. Typically, the default script will probably try and resize them all to some consistent height or width (retaining the aspect ratio, of course), but I’m sure if you wanted them in different sizes, a bit of code will do the trick.
Hopefully, in few days, I can post Part 2 with some examples of printing observation reports.
John Grismore | 24-Dec-08 at 1:40 pm | Permalink
On the Mac it’s possible to “print to PDF”. Will this be available within print scripting? There might be some interesting uses for that.
admin | 24-Dec-08 at 1:51 pm | Permalink
@John
Yes. Anywhere you can print in AP V2, you can print to a PDF file via the built-in OS feature. Sorry Windows users, you’ll need additional software (e.g. Adobe Acrobat) in order to do that.