If you look at the object list in AstroPlanner, you will see a whole bunch of properties associated with those objects. Some of those properties remain constant over time (for non-solar-system objects, e.g. Magnitudes, RA/Dec coordinates, etc.), while other properties vary with the passage of time (e.g. Altitude, hour angle, parallactic angle, etc.).Â
It’s difficult to see how these latter properties change over, say, the course of an observing session. For some purposes, especially if you’re an astroimager, it’s important to know what those changes are. Enter a new feature to help with this kind of visualisation.
You select one or more object and in the object list (using dragging, shift- or cmd-clicking) and use the Object > Object Properties vs. Time menu command.

A window is opened and you can select from a list of time-dependent properties to plot. You also specify the time period over which you are interested and the number of data points. Charts are drawn for each selected property, and each chart contains a line for each selected object (where applicable).
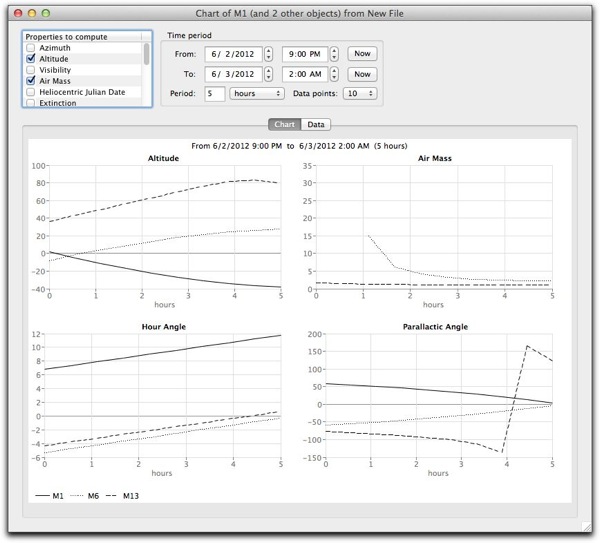
In the above example, three objects (M1, M6 and M13) were chosen, and the properties Altitude, Air Mass, Hour Angle and Parallactic angle were chosen.
From the first chart (Altitude) it is fairly easy to see that M1 never rises during the 5 hour period, M6 rises about 30 minutes in, and M13 is always visible, and transits at about the 4.5 hour mark (you can move the cursor over each chart to see actual values). The Hour Angle chart can also be used to determine best time to image – the lines cross the 0 hour angle line when the object transits the meridian. And so on.
The charts can be printed.
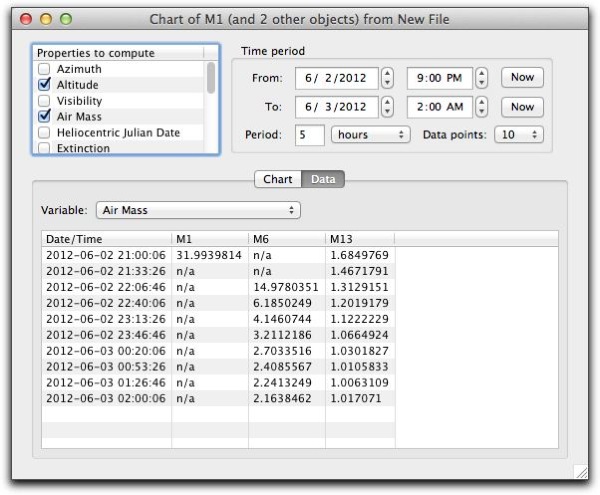
The Data tab contains the numeric data for the charts, which can be exported or copied if you so desire.

Of course, in writing this, it occurred to me that it might be useful to include time-dependent properties for solar-system objects (i.e. RA, Dec, Magnitude).